用python+sklearn(机器学习)实现天气预测
/ 21 min read
Table of Contents
项目地址
系列教程
本文章为以下几篇的合集 机器学习参考篇: python+sklearn+kaggle机器学习 用python+sklearn(机器学习)实现天气预报 准备 用python+sklearn(机器学习)实现天气预报数据 数据 用python+sklearn(机器学习)实现天气预报 模型和使用
0.流程介绍
爬虫爬取去年今日的半个月前到去年今日的下个半个月的每日天气数据做训练集和训练验证集,爬取现在半个月前到现在的每日天气数据做预测数据集 -> 数据预处理 -> 训练模型和预测
机器学习过程可参考上面那篇
1. 环境搭建
a.python
如题,要使用python+sklearn做,所以肯定要搭建好python的环境,教程百度有很多,建议用python3.*
1.1 涉及到的机器学习相关库
安装命令:
pip install 库名1.1.1 sklearn
本教程运用的机器学习核心库
1.1.2 panda
读取csv相关
1.1.3 seaborn
数据可视化,生成图表如折线图等
1.1.4 joblib
保存和读取训练好的模型,*.pkl文件
2.寻找数据来源
做机器学习我们需要尽量多和准确的数据,本次实例从www.meteomanz.com获取免费的天气数据
3.分析数据源网址规则
我们访问上一步的网站,可以发现有选择城市和时间的接口(PS:右上角的链接可以切换成英文
)
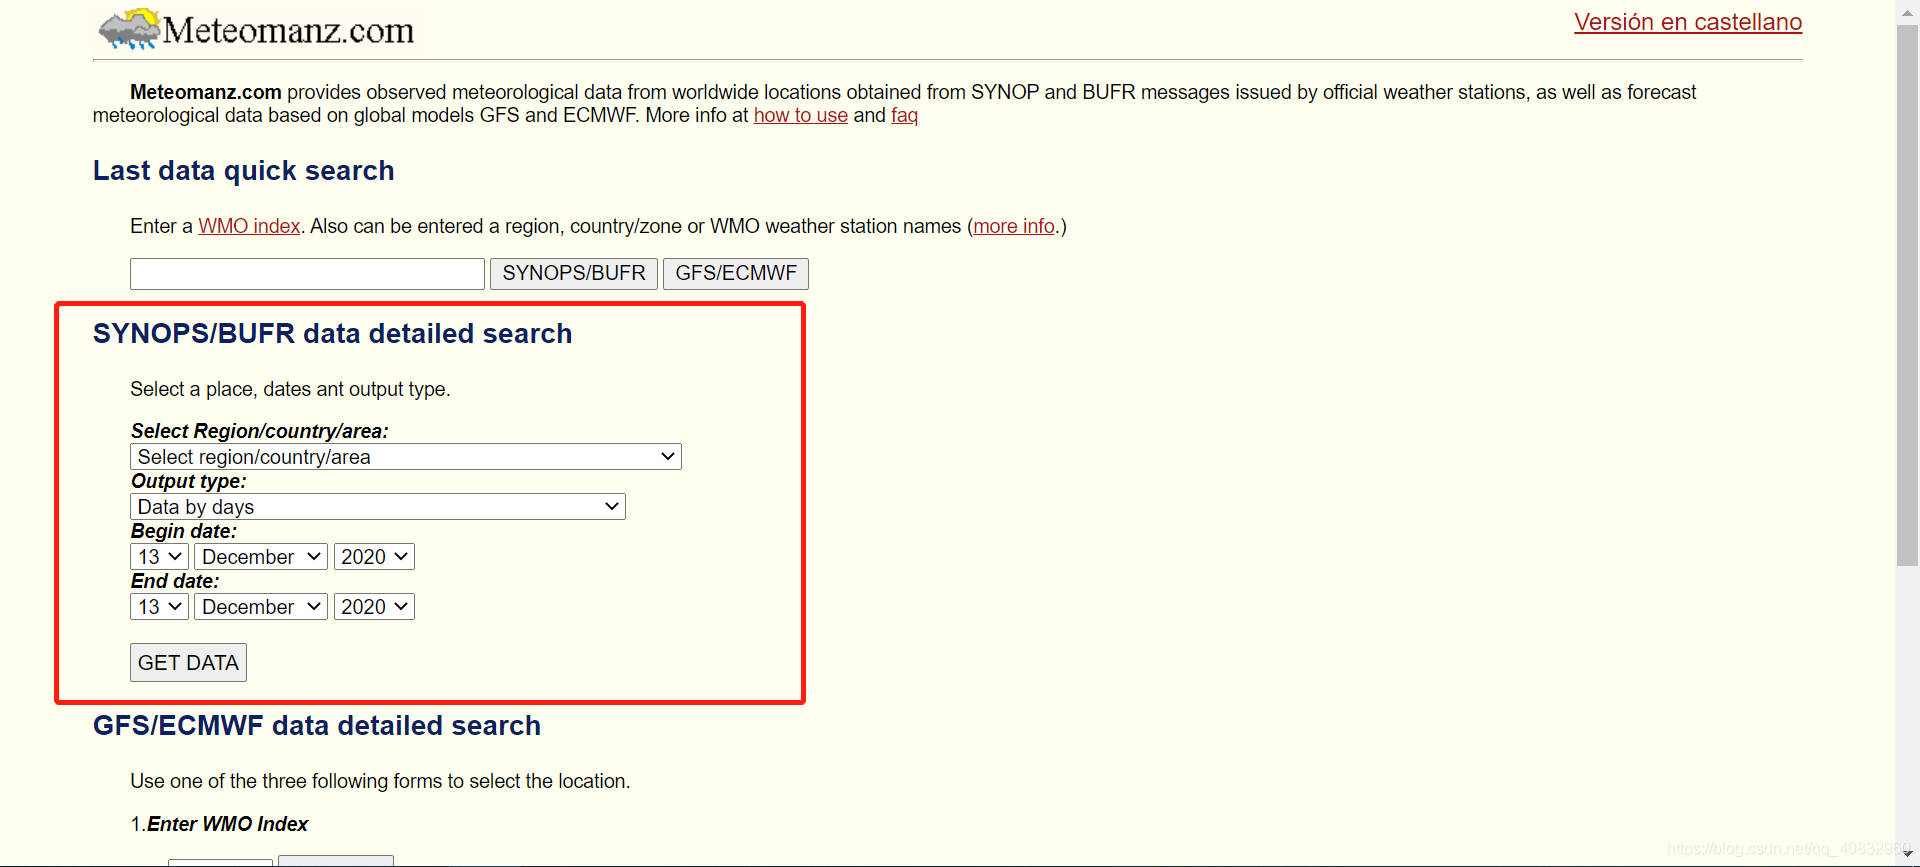 接下来我们选择我们要做天气预报的城市和顺便一个时间点,如广州(PS:在选择框直接输入城市的前几个字符可以快速索引
)
接下来我们选择我们要做天气预报的城市和顺便一个时间点,如广州(PS:在选择框直接输入城市的前几个字符可以快速索引
)
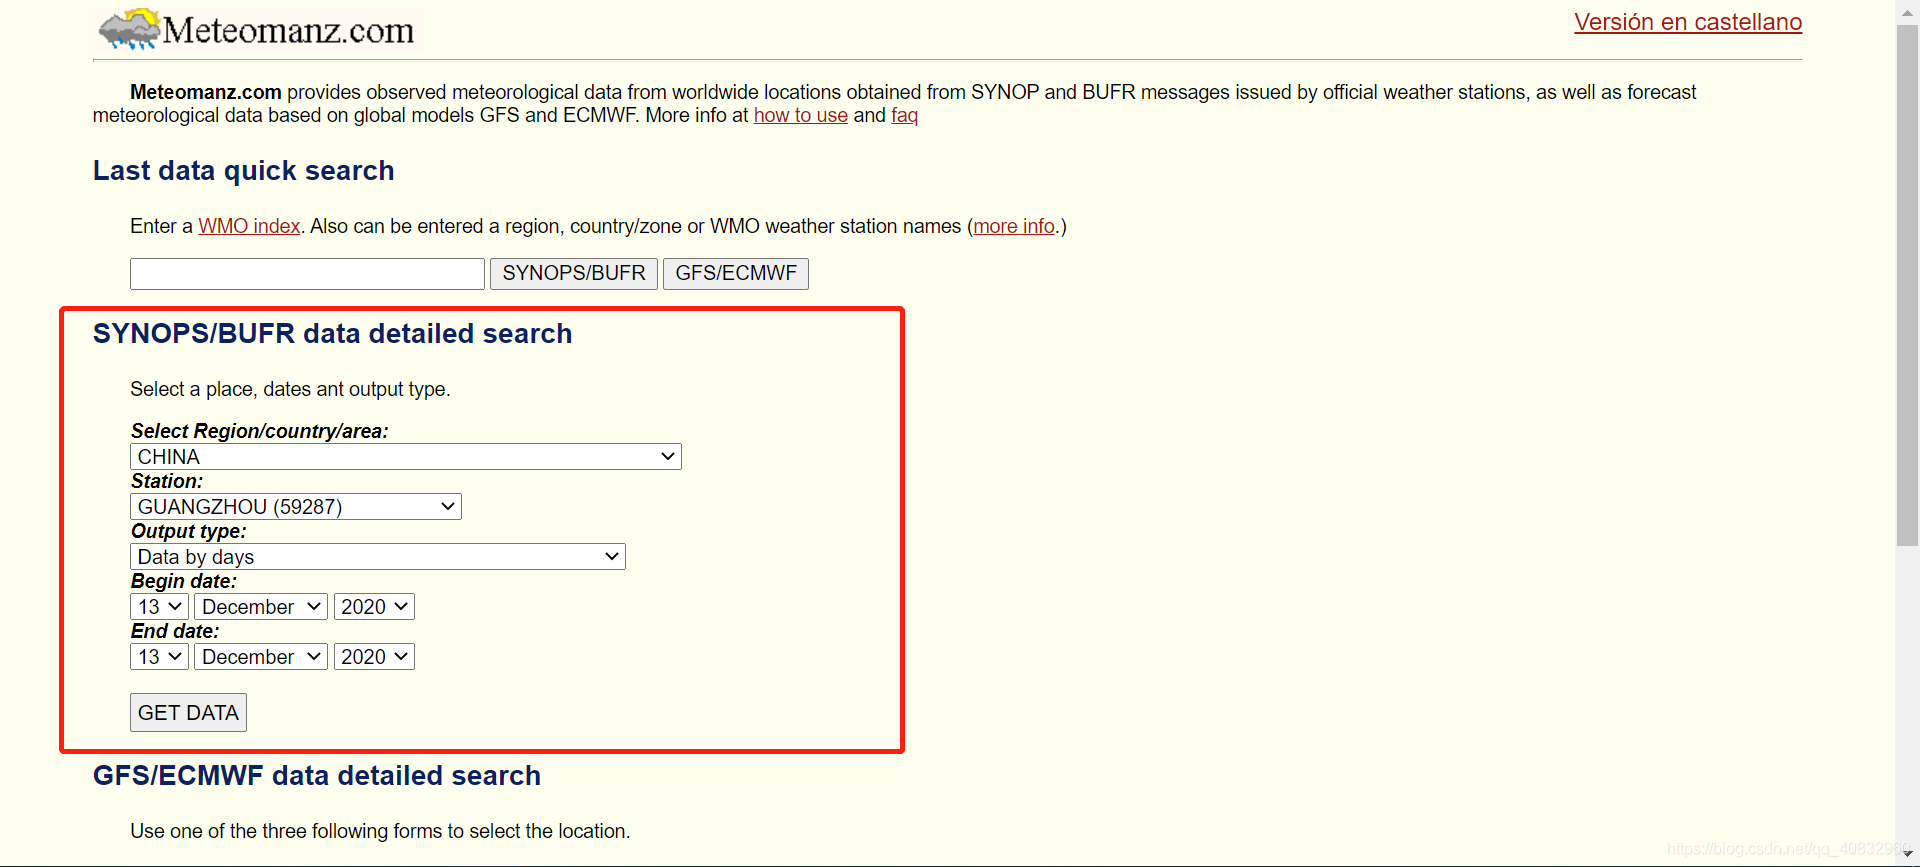 然后点按钮,我们会跳转到一个网页
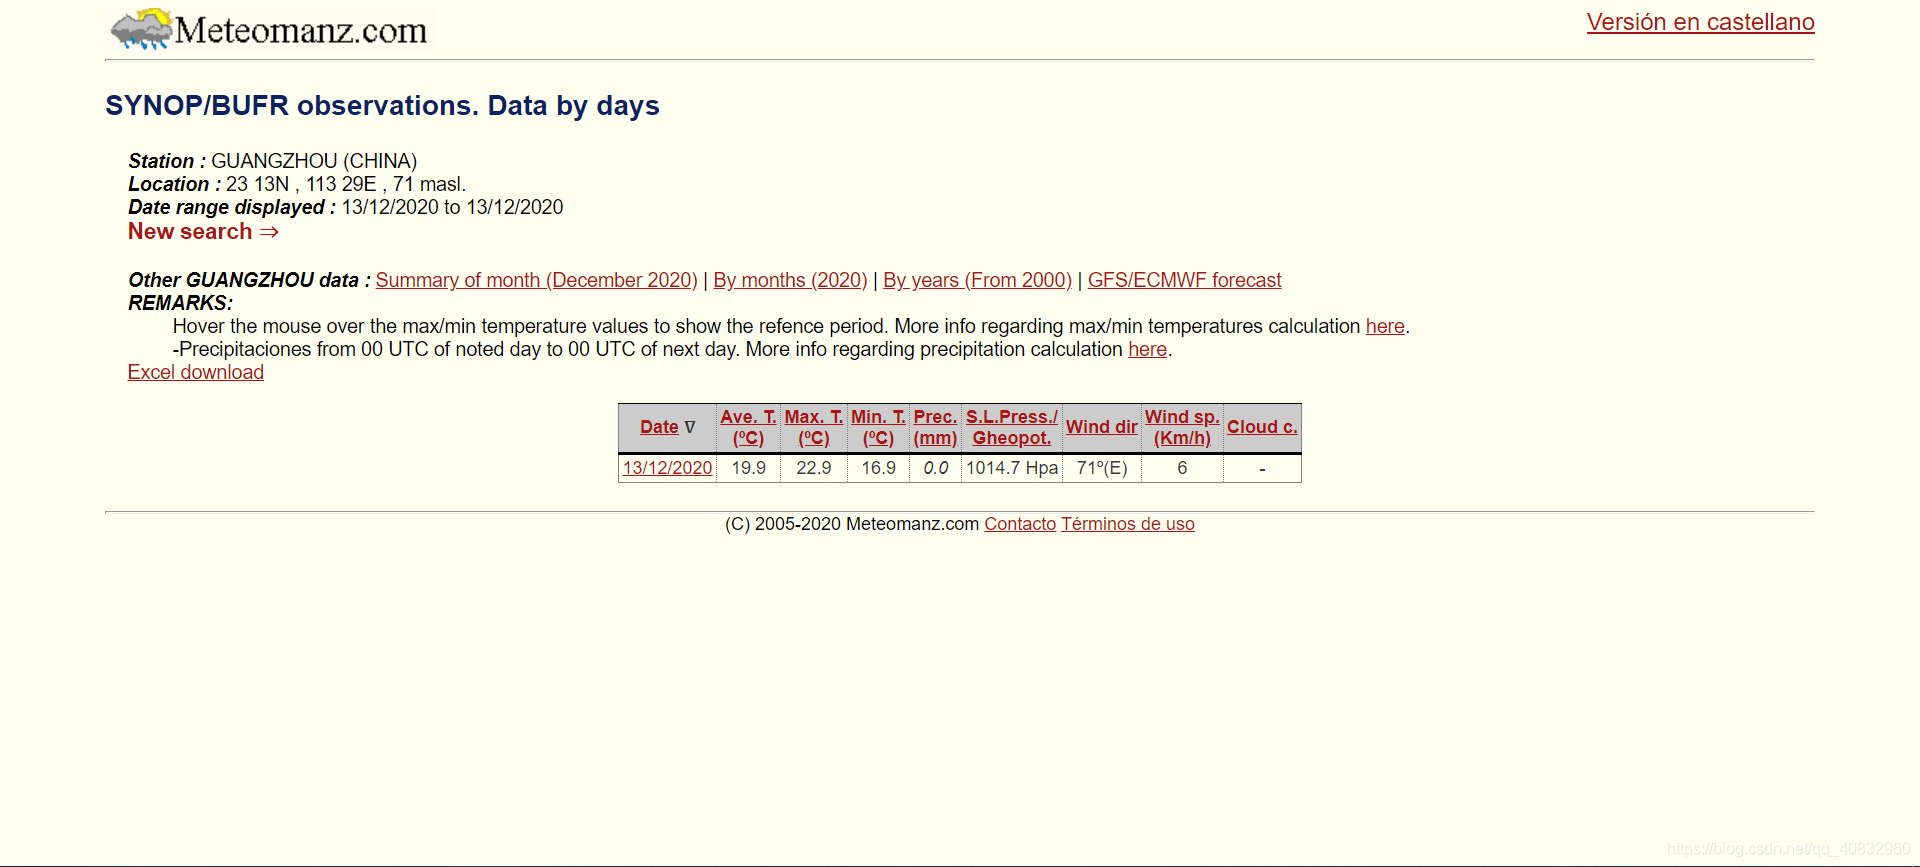 这个就是我们要取到的数据了的地址,不过时间不对,接下来解析这个网址的规则,如
http://www.meteomanz.com/sy2?l=1&cou=2250&ind=59287&d1=13&m1=12&y1=2020&d2=13&m2=12&y2=2020这里面
?前的分别是http://网络协议,www.meteomanz.com域名,/sy2地址,我们主要关注?后的参数l是语言参数,l=1指英语cou和ind是地区和城市代码d1,m1,y1是时间段的开始年月日d2,m2,y2是时间段的结束年月日
所以
http://www.meteomanz.com/sy2?l=1&cou=2250&ind=59287&d1=02&m1=02&y1=2019&d2=13&m2=12&y2=2020指从2019/2/2到2020/12/13的广州的每日天气数据,不要忘记里面月和日是要补0的,但是进去就发现最多给30天的数据,所以我们以后并不会用到怎么多天的数据
4.分析页面规则
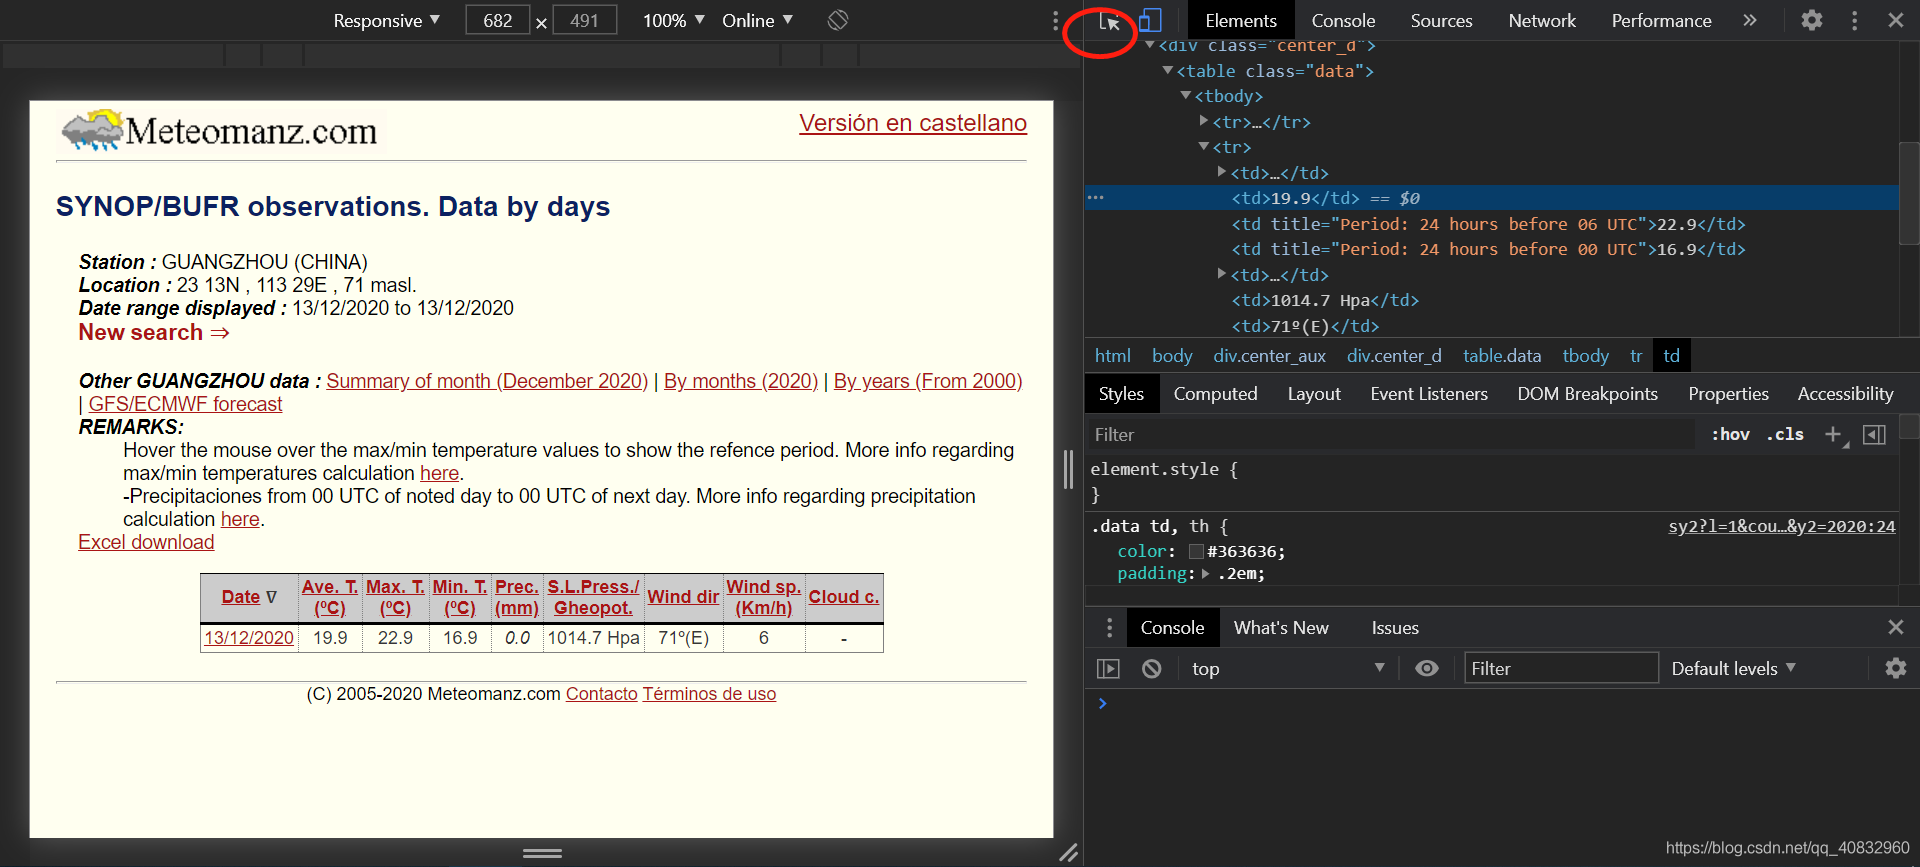
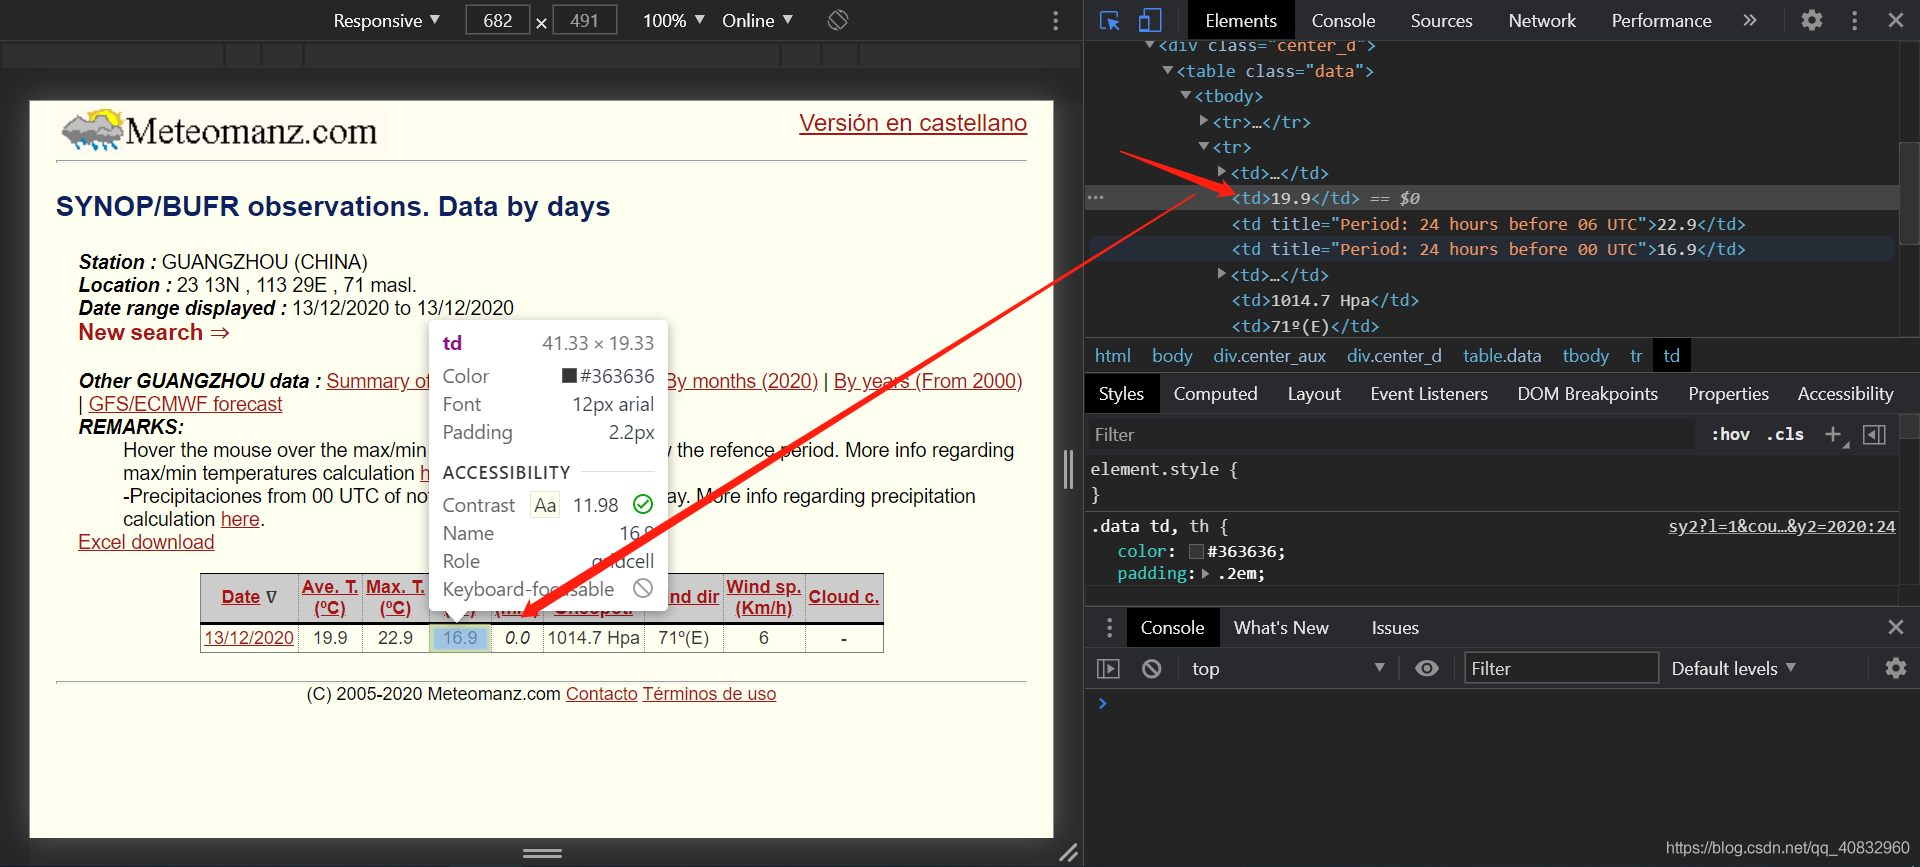
获取到网址规则后,分析页面规则用于爬虫匹配数据,按F12打开开发者工具
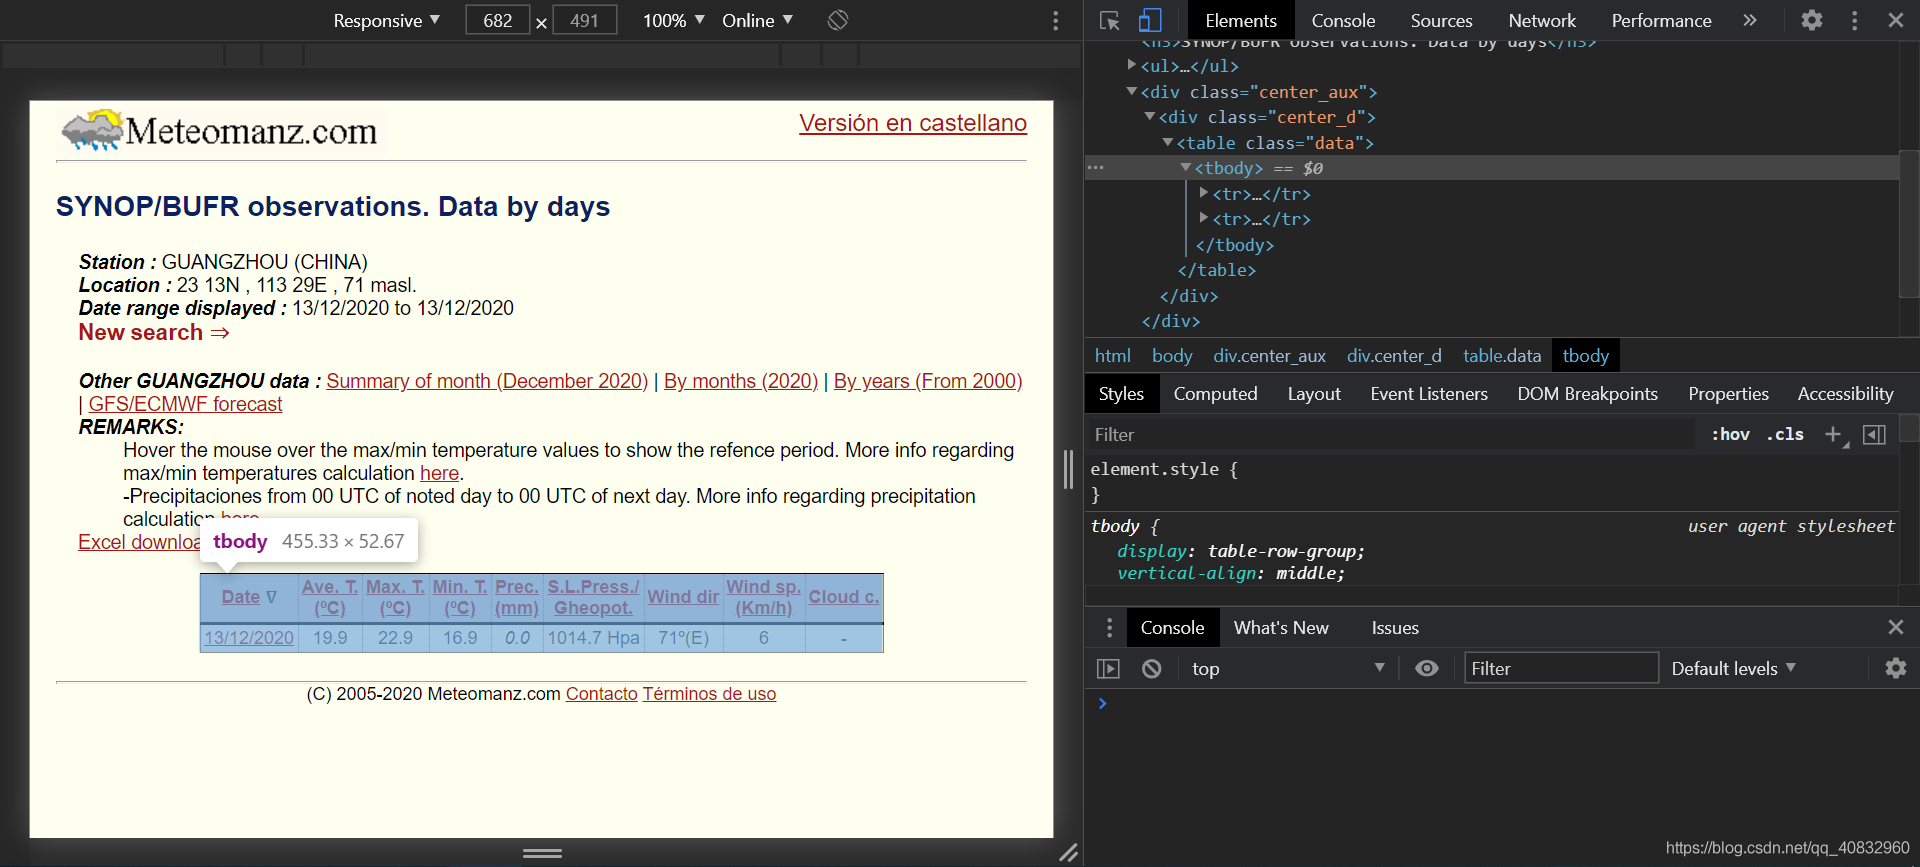 如图,我们可以发现rbody里面的第二个tr标签里面的每个td里是数据(PS:用右上角的左边第一个小按钮然后点击那些数据
)。
如图,我们可以发现rbody里面的第二个tr标签里面的每个td里是数据(PS:用右上角的左边第一个小按钮然后点击那些数据
)。
当我们知道了这些规则,接下来就可以写爬虫爬取符合条件的数据集了。
勘误表
-
感谢”Gbilibili”的提醒,下面url代码生成片段应从
# 爬取数据链接url = "http://www.meteomanz.com/sy2?l=1&cou=2250&ind=59287&d1=" +str(week_ago.day).zfill(2) +"&m1=" + str(week_ago.month).zfill(2) +"&y1=" + str(week_ago.month) +"&d2=" + str(week_pre.day - years[0]).zfill(2) +"&m2=" + str(week_pre.month).zfill(2) +"&y2=" + str(week_pre.year - years[1])改成
# 爬取数据链接url = "http://www.meteomanz.com/sy2?l=1&cou=2250&ind=59287&d1=" +str(week_ago.day).zfill(2) +"&m1=" + str( week_ago.month).zfill(2) +"&y1=" + str(week_ago.year - years[0]) +"&d2=" + str(week_pre.day).zfill(2) +"&m2=" + str(week_pre.month).zfill(2) +"&y2=" + str(week_pre.year - years[1]) -
感谢@L-Zzxnn的提醒,代码已添加负温度支持,最新代码请以github上为准
5.爬虫
爬虫这方面可以参考我之前的一篇文章
5.1确认要被爬取的网页网址
首先我们主要要爬取去年今日的半个月前到去年今日,而根据上一篇我们得出的网址规则,我们可以得到(PS:真正的链接里是没有换行的 )
http://www.meteomanz.com/sy2?l=1&cou=2250&ind=59287&d1=去年今日的半个月前的日&m1=去年今日的半个月前的月份&y1=去年年份&d2=今天的日期的日&m2=今天的日期的月份&y2=今年年份而为什么是取去年和时间要半个月呢?因为去年的天气环境相比于前年或者更久之前是和我们现在的天气条件更相似的,可以减少误差,半个月而不是一个星期是因为使用多的数据量可以减少误差,不是一个月而是因为网站的限制,而且在实验中也会增加少量的误差。所以最终取用了去年和半个月的时间。
如果我们是只测今天这一次上面的网址就可以人工填写,但是如果我们要做不用人工填就要用datetime这个python库
如下:
import datetime as DT
# 取现在日期today = DT.datetime.now()# 取b[0]天前日期week_ago = (today - DT.timedelta(days=b[0])).date() # b[1]天后 week_pre = (today + DT.timedelta(days=b[1])).date()我们传入b = [-15 0],就可以获取上个半月的日期在week_ago里,今天的日期在week_pre里
所以,可以用这一行构建需要的网址
# 爬取数据链接url = "http://www.meteomanz.com/sy2?l=1&cou=2250&ind=59287&d1=" + str(week_ago.day).zfill(2) + "&m1=" + str( week_ago.month).zfill(2) + "&y1=" + str(week_ago.year - years[0]) + "&d2=" + str(week_pre.day).zfill(2) + "&m2=" + str(week_pre.month).zfill(2) + "&y2=" + str(week_pre.year - years[1])其中.zfill(2)是指填充2位,比如如果是1就返回01,如果是12就返回12
有了网址,接下来就是爬虫爬取网页然后分析网页元素取出里面的数据
5.2 爬虫部分
首先先写爬虫部分,这部分很简单,写了个GetData class
# -*- coding: utf-8 -*-# @Time: 2020/12/16# @Author: Eritque arcus# 功能: 爬取数据import urllib3
class GetData: url = "" headers = ""
def __init__(self, url, header=""): """ :param url: 获取的网址 :param header: 请求头,默认已内置 """ self.url = url if header == "": self.headers = { 'Connection': 'Keep-Alive', 'Accept': 'text/html,application/xhtml+xml,application/xml;q=0.9,image/avif,image/webp,image/apng,' '*/*;q=0.8,application/signed-exchange;v=b3;q=0.9', 'Accept-Language': 'zh-CN,zh;q=0.9,en;q=0.8', 'Accept-Encoding': 'gzip, deflate', 'User-Agent': 'Mozilla/5.0 (Linux; Android 6.0; Nexus 5 Build/MRA58N) AppleWebKit/537.36 (KHTML, ' 'like Gecko) Chrome/87.0.4280.66 Mobile Safari/537.36 ', 'Host': 'www.meteomanz.com' } else: self.headers = header
def Get(self): """ :return: 网址对应的网页内容 """ http = urllib3.PoolManager() return http.request('GET', self.url, headers=self.headers).data本处用了urllib3库和GET方式,其中headers是申请头,这部分可以在按F12调出开发者工具,在Network那一栏,点击任意一个事件,往下滑就有了,可以用我的也可以。请求头主要是http协议里的东西,想要了解可以自行搜索。
5.3 网页内容匹配取出部分
本处使用了BeautifulSoup库
g = GetData(url).Get() # beautifulsoup解析网页 soup = BeautifulSoup(g, "html5lib") # 取<tbody>内容 tb = soup.find(name="tbody") # 取tr内容 past_tr = tb.find_all(name="tr") for tr in past_tr: # 取tr内每个td的内容 text = tr.find_all(name="td") flag = False for i in range(0, len(text)): if i == 0: text[i] = text[i].a.string # 网站bug,跨月请求的话会给每个月第0天的数据,但是里面是全空的因为日期不存在,比如 00/11/2020(日/月/年),所以要手动drop掉这个数据 if "00/" in text[i]: flag = True elif i == 8: # 把/8去掉,网页显示的格式问题 text[i] = text[i].string.replace("/8", "") elif i == 5: # 去掉Hpa单位 text[i] = text[i].string.replace(" Hpa", "") elif i == 6: # 用正则去掉风力里括号内的内容 text[i] = re.sub(u"[º(.*?|N|W|E|S)]", "", text[i].string) else: # 取每个元素的内容 text[i] = text[i].string # 丢失数据都取2(简陋做法) # 这么做 MAE=3.6021 text[i] = text[i].replace("-", "2") text[i] = text[i].replace("Tr", "2")如果有什么不清楚的评论里答复。
5.4写入csv文件格式化
import csv # 创建文件对象 f = open(c, 'w', encoding='utf-8', newline='')
# 基于文件对象构建 csv写入对象 csv_writer = csv.writer(f) # 写入内容,text数组 csv_writer.writerow(text) # 关闭文件 f.close()5.6封装成类
# -*- coding: utf-8 -*-# @Time: 2020/12/16# @Author: Eritque arcus# @File: Write.pyimport refrom bs4 import BeautifulSoupfrom GetData import GetDataimport datetime as DTimport csv
def a(t): return t.replace(" - ", "0")
# 功能: 写csvdef write(years, b, c): """ :param years: [开始日期距离现在的年份, 结束日期距离现在的年份] :param b: [开始日期距离现在日期的天数, 结束日期距离现在日期的天数] :param c: csv文件名 :return: None """ # 1. 创建文件对象 f = open(c, 'w', encoding='utf-8', newline='')
# 2. 基于文件对象构建 csv写入对象 csv_writer = csv.writer(f)
# 3. 构建列表头 # , "negAve", "negMax", "negMin" csv_writer.writerow(["Time", "Ave_t", "Max_t", "Min_t", "Prec", "SLpress", "Winddir", "Windsp", "Cloud"]) # 取现在日期 today = DT.datetime.now() # 取20天前日期 week_ago = (today - DT.timedelta(days=b[0])).date() # 20天后 week_pre = (today + DT.timedelta(days=b[1])).date() # 城市id 广州59287 青岛 54857 id = "59287" # 爬取数据链接 url = "http://www.meteomanz.com/sy2?l=1&cou=2250&ind=" + id + "&d1=" + str(week_ago.day).zfill(2) + "&m1=" + str( week_ago.month).zfill(2) + "&y1=" + str(week_ago.year - years[0]) + "&d2=" + str(week_pre.day).zfill( 2) + "&m2=" + str(week_pre.month).zfill(2) + "&y2=" + str(week_pre.year - years[1]) # 显示获取数据集的网址 print(url) g = GetData(url).Get() # beautifulsoup解析网页 soup = BeautifulSoup(g, "html5lib") # 取<tbody>内容 tb = soup.find(name="tbody") # 取tr内容 past_tr = tb.find_all(name="tr") for tr in past_tr: # 取tr内每个td的内容 text = tr.find_all(name="td") flag = False negA = negMax = negMin = False for i in range(0, len(text)): if i == 0: text[i] = text[i].a.string # 网站bug,会给每个月第0天,比如 00/11/2020,所以要drop掉 if "00/" in text[i]: flag = True elif i == 8: # 把/8去掉,网页显示的格式 text[i] = text[i].string.replace("/8", "") elif i == 5: # 去掉单位 text[i] = text[i].string.replace(" Hpa", "") elif i == 6: # 去掉风力里括号内的内容 text[i] = re.sub(u"[º(.*?|N|W|E|S)]", "", text[i].string) else: # 取每个元素的内容 text[i] = text[i].string # 丢失数据都取2(简陋做法) # 这么做 MAE=3.6021 text[i] = "2" if text[i] == "-" else text[i] text[i] = "2" if text[i] == "Tr" else text[i] text = text[0:9] # ext += [str(int(negA)), str(int(negMax)), str(int(negMin))] # 4. 写入csv文件内容 if not flag: csv_writer.writerow(text) # 5. 关闭文件 f.close()# -*- coding: utf-8 -*-# @Time: 2020/12/16# @Author: Eritque arcus# @File: GetData.py# 功能: 爬取数据import urllib3
class GetData: url = "" headers = ""
def __init__(self, url, header=""): """ :param url: 获取的网址 :param header: 请求头,默认已内置 """ self.url = url if header == "": self.headers = { 'Connection': 'Keep-Alive', 'Accept': 'text/html,application/xhtml+xml,application/xml;q=0.9,image/avif,image/webp,image/apng,' '*/*;q=0.8,application/signed-exchange;v=b3;q=0.9', 'Accept-Language': 'zh-CN,zh;q=0.9,en;q=0.8', 'Accept-Encoding': 'gzip, deflate', 'User-Agent': 'Mozilla/5.0 (Linux; Android 6.0; Nexus 5 Build/MRA58N) AppleWebKit/537.36 (KHTML, ' 'like Gecko) Chrome/87.0.4280.66 Mobile Safari/537.36 ', 'Host': 'www.meteomanz.com' } else: self.headers = header
def Get(self): """ :return: 网址对应的网页内容 """ http = urllib3.PoolManager() return http.request('GET', self.url, headers=self.headers).data到时候就可以直接用一行命令取得天气数据了,如下面是取去年今日的20天到去年今日的天气数据
# 用近几年的数据做训练集 # 如 [1,1], [20, 0]就是用2019年的今天的20天前到2019年的今天数据做训练集 # 写入csv Write([1, 1], [20, 0], "weather_train_train.csv")结果如下
Time,Ave_t,Max_t,Min_t,Prec,SLpress,Winddir,Windsp,Cloud
07/12/2019,14.8,20.8,8.8,0.0,1026.3,331,11,006/12/2019,15.2,19.8,10.7,0.0,1026.6,344,15,005/12/2019,14.5,20.4,8.6,2,1026.2,346,13,804/12/2019,13.8,20.4,7.1,0.0,1024.7,335,16,203/12/2019,13.0,18.9,7.1,0.0,1024.8,330,10,002/12/2019,18.2,24.9,11.5,0.0,1024.8,347,18,301/12/2019,18.1,24.9,11.4,0.0,1020.9,332,16,130/11/2019,17.5,23.6,11.4,0.0,1020.5,352,8,329/11/2019,15.8,20.1,11.5,0.0,1023.6,349,11,428/11/2019,20.4,27.1,13.8,0.0,1024.5,337,19,327/11/2019,21.9,27.1,16.6,0.0,1021.3,336,12,026/11/2019,22.2,28.4,16.1,0.0,1021.1,356,6,625/11/2019,22.2,29.3,15.2,0.0,1020.8,344,13,324/11/2019,21.4,29.3,13.6,0.0,1018.5,346,5,023/11/2019,20.7,28.4,13.0,0.0,1017.2,352,5,122/11/2019,19.6,27.6,11.6,0.0,1017.3,331,6,021/11/2019,18.4,25.1,11.6,0.0,1019.1,323,9,120/11/2019,18.3,24.2,12.4,0.0,1020.3,338,7,019/11/2019,19.1,25.4,12.8,0.0,1020.5,342,11,018/11/2019,22.2,28.8,15.7,0.0,1018.8,342,17,017/11/2019,22.2,28.8,15.7,0.0,1015.2,358,7,36.数据预处理
如果在把上面的数据作为数据集训练,我们还需要做些数据的预处理,因为有些情况下我们得到的数据会有残缺,这种情况我们就要选择抛弃那一列或者用方差或其他什么的方法填充缺少的数据。
因为在我已经决定把数据里丢失的项全部取2了,所以下面我会列出可能的解决方法而不使用。
新建个ProcessData.py里建立ProcessData方法以获得数据
# -*- coding: utf-8 -*-# @Time: 2020/12/16# @Author: Eritque arcus# @File: ProcessData.pyfrom Write import Writeimport pandas as pdfrom sklearn.model_selection import train_test_splitfrom sklearn.impute import SimpleImputerimport seaborn as snsimport matplotlib.pyplot as plt
# 功能: 数据预处理def ProcessData(): """ :return: [X_train X训练数据集, X_valid X训练数据集的验证集, y_train Y训练数据集, y_valid Y训练数据集的验证集, imputed_X_test 预测数据集] """ # 用近几年的数据做训练集 # 如 [1,1], [20, 0]就是用2019年的今天的20天前到2019年的今天数据做训练集 # 写入csv Write([1, 1], [20, 0], "weather_train_train.csv") Write([1, 1], [0, 20], "weather_train_valid.csv") Write([0, 0], [20, 0], "weather_test.csv") X_test = pd.read_csv("weather_test.csv", index_col="Time", parse_dates=True) # 读取测试集和验证集 X = pd.read_csv("weather_train_train.csv", index_col="Time", parse_dates=True) y = pd.read_csv("weather_train_valid.csv", index_col="Time", parse_dates=True) # 把全部丢失的数据都drop,MAE=3.7又高了,所以去掉了 # dxtcol = [col for col in X_test.columns # if X_test[col].isnull().all()] # dxcol = [col for col in X.columns # if X[col].isnull().all()] # dycol = [col for col in y.columns # if y[col].isnull().all()] # for a1 in [dxtcol, dxcol, dycol]: # for a2 in a1: # if a2 in X_test.columns: # X_test = X_test.drop(a2, axis=1) # if a2 in X.columns: # X = X.drop(a2, axis=1) # if a2 in y.columns: # y = y.drop(a2, axis=1) # 数据归一化和标准化,无法还原不用 # scaler = preprocessing.StandardScaler() # pars = [cols for cols in X.columns if cols != "Time"] # for data in [X, y, X_test]: # for par in pars: # data[par] = scaler.fit_transform(data[par].values.reshape(-1, 1)) # # temp = scaler.fit(data[par].values.reshape(-1, 1)) # # data[par] = scaler.fit_transform(data[par].values.reshape(-1, 1), temp)
# 填充缺少的数值用方差,不清楚效果如何 my_imputer = SimpleImputer() X_train, X_valid, y_train, y_valid = train_test_split(X, y, train_size=0.8, test_size=0.2, random_state=0) imputed_X_train = pd.DataFrame(my_imputer.fit_transform(X_train)) imputed_X_valid = pd.DataFrame(my_imputer.transform(X_valid)) imputed_X_train.columns = X_train.columns imputed_X_valid.columns = X_valid.columns imputed_y_train = pd.DataFrame(my_imputer.fit_transform(y_train)) imputed_y_valid = pd.DataFrame(my_imputer.transform(y_valid)) imputed_y_train.columns = y_train.columns imputed_y_valid.columns = y_valid.columns imputed_X_test = pd.DataFrame(my_imputer.fit_transform(X_test))
# 画折线图 # sns.lineplot(data=X) # plt.show() # sns.lineplot(data=y) # plt.show() # sns.lineplot(data=X_test) # plt.show() # 返回分割后的数据集 return [imputed_X_train, imputed_X_valid, imputed_y_train, imputed_y_valid, imputed_X_test]7.建立模型
7.1准备
7.1.1 引入所需要的头文件
from sklearn.ensemble import RandomForestRegressor # 随机树森林模型import joblib # 保存模型为pklfrom sklearn.metrics import mean_absolute_error # MAE评估方法from ProcessData import ProcessData # 取数据7.1.2 选择模型
首先我们先要从模型里选择一项适合这次场景的模型,比如从决策树,随机树森林,RGB模型等等中选择,本处选用的随机树森林也就是 RandomForest
7.1.3 选择评估方法
目前有许多的模型准确率评估方法,本处使用的是MAE,也就是mean_absolute_error 平均错误数值,就每个预测的数值离正确数值错误数值的平均数
7.1.4 获取数据集
这次可以从ProcessData()获取到全部的被预处理后的数据,如
# 取到数据 [X_train, X_valid, y_train, y_valid, X_test] = ProcessData()7.2建立模型
# 用XGB模型,不过用有bug # modelX = XGBRegressor(n_estimators=1000, learning_rate=0.05, random_state=0, n_jobs=4) # # model.fit(X_train_3, y_train_3) # # model.fit(X_train_2, y_train_2) # col = ["Ave_t", "Max_t", "Min_t", "Prec","SLpress", "Winddir", "Windsp", "Cloud"] # modelX.fit(X_train, y_train, # early_stopping_rounds=5, # eval_set=[(X_valid, y_valid)], # verbose=False) # 随机树森林模型 model = RandomForestRegressor(random_state=0, n_estimators=1001) # 训练模型 model.fit(X_train, y_train)其中n_estimators是可自己选的,不过在多次调试后得到1001是MAE最优
7.3 获取模型评估结果
# 用MAE评估 score = mean_absolute_error(y_valid, preds)7.4 用joblib模块保存模型
保存后的模型便于传播即可多次使用,但当前环境下的需求不大但我还是写了
# 保存模型到本地 joblib.dump(model, a)7.5 封装
# -*- coding: utf-8 -*-# @Time: 2020/12/16# @Author: Eritque arcus# @File: GetModel.pyfrom sklearn.ensemble import RandomForestRegressorimport joblibfrom sklearn.metrics import mean_absolute_errorfrom ProcessData import ProcessData
# 训练并保存模型def GetModel(a="Model.pkl"): """ :param a: 模型文件名 :return: [socre: MAE评估结果, X_test: 预测数据集] """ # 取到数据 [X_train, X_valid, y_train, y_valid, X_test] = ProcessData() # 用XGB模型,不过用有bug # modelX = XGBRegressor(n_estimators=1000, learning_rate=0.05, random_state=0, n_jobs=4) # # model.fit(X_train_3, y_train_3) # # model.fit(X_train_2, y_train_2) # col = ["Ave_t", "Max_t", "Min_t", "Prec","SLpress", "Winddir", "Windsp", "Cloud"] # modelX.fit(X_train, y_train, # early_stopping_rounds=5, # eval_set=[(X_valid, y_valid)], # verbose=False) # 随机树森林模型 model = RandomForestRegressor(random_state=0, n_estimators=1001) # 训练模型 model.fit(X_train, y_train) # 预测模型,用上个星期的数据 preds = model.predict(X_valid) # 用MAE评估 score = mean_absolute_error(y_valid, preds) # 保存模型到本地 joblib.dump(model, a) # 返回MAE return [score, X_test]8 总控
8.1 代码
这几篇文章写了零零散散好几个类,所以要写个总文件也就是启动文件串起来,然后在控制台输出
# -*- coding: utf-8 -*-# @Time: 2020/12/16# @Author: Eritque arcus# @File: Main.pyimport joblibimport datetime as DTfrom GetModel import GetModelimport matplotlib.pyplot as plt
# 训练并保存模型并返回MAEr = GetModel()print("MAE:", r[0])# 读取保存的模型model = joblib.load('Model.pkl')
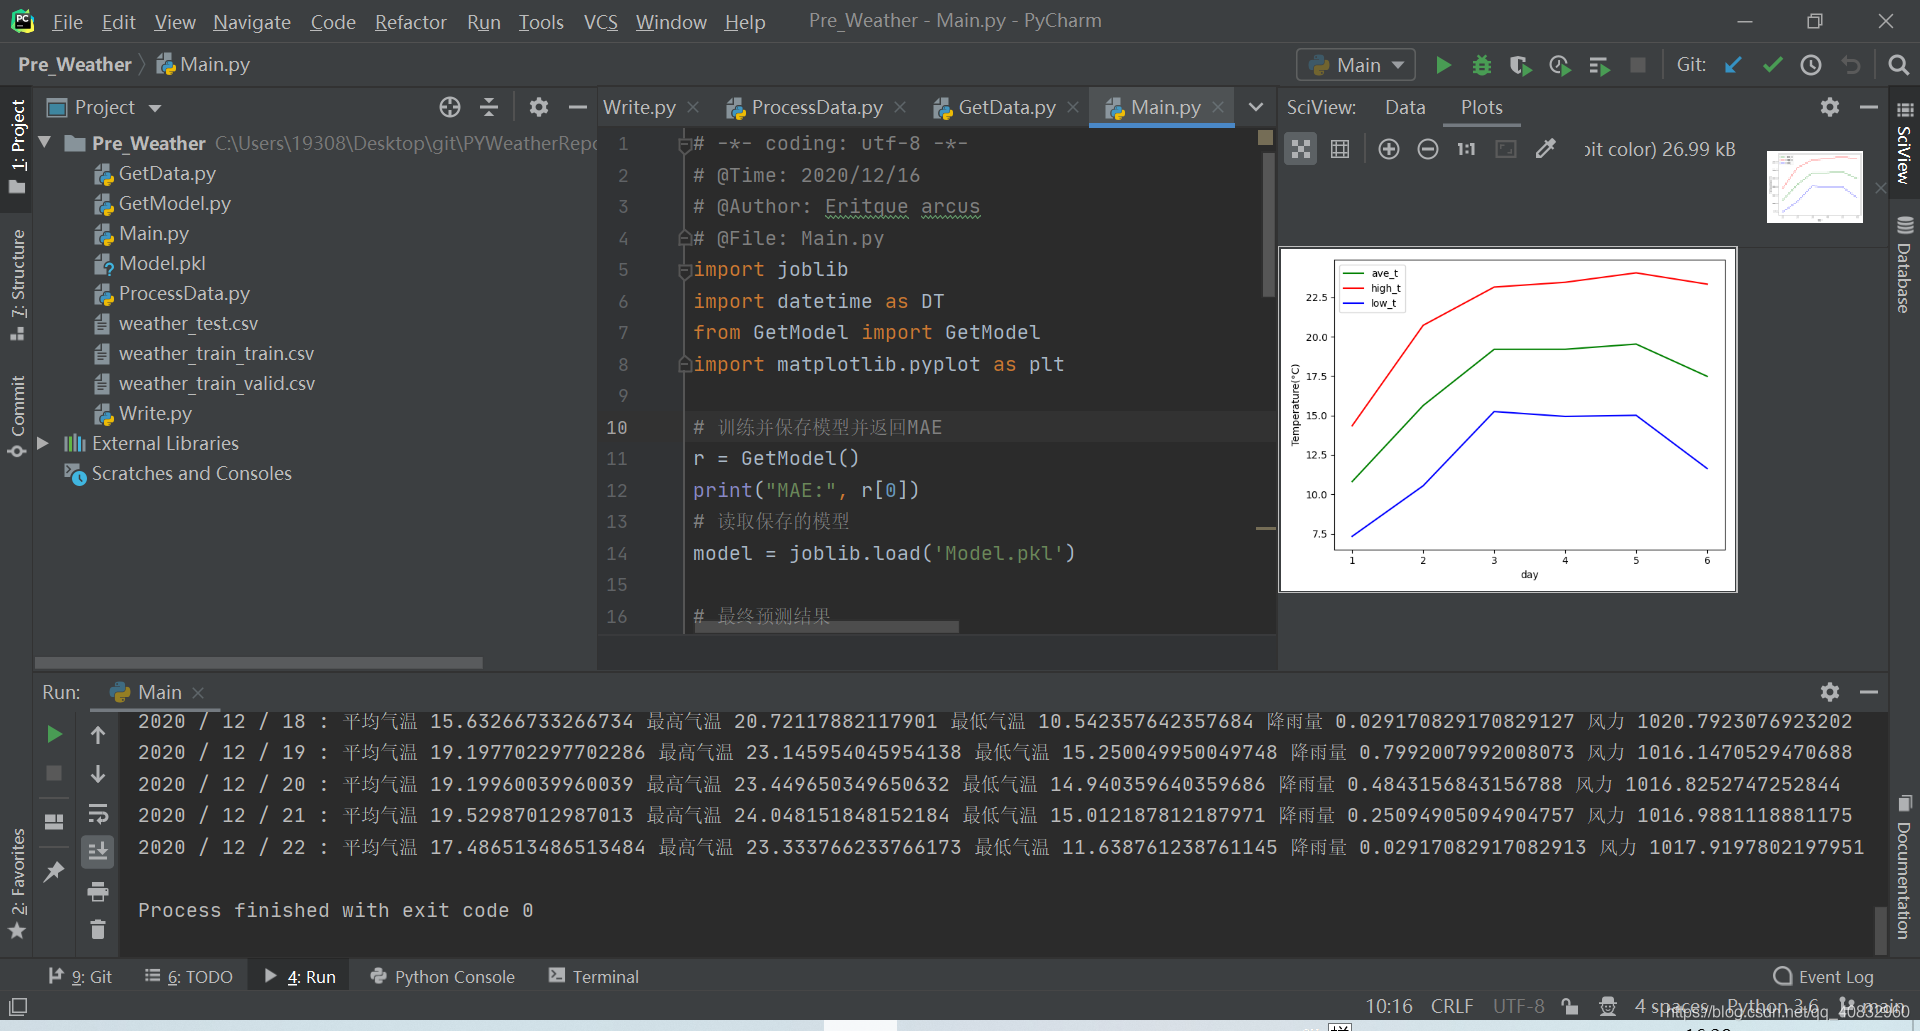
# 最终预测结果preds = model.predict(r[1])# 反归一化或标准化,不过出bug了,不用# for cols in range(0, len(preds)):# preds[cols] = scaler.inverse_transform(preds[cols])# sns.lineplot(data=preds)# plt.show()# 打印结果到控制台print("未来7天预测")print(preds)all_ave_t = []all_high_t = []all_low_t = []for a in range(1, 7): today = DT.datetime.now() time = (today + DT.timedelta(days=a)).date() print(time.year, '/', time.month, '/', time.day, ': 平均气温', preds[a][0], '最高气温', preds[a][1], '最低气温', preds[a][2], "降雨量", preds[a][3], "风力", preds[a][4]) all_ave_t.append(preds[a][0]) all_high_t.append(preds[a][1]) all_low_t.append(preds[a][2])temp = {"ave_t": all_ave_t, "high_t": all_high_t, "low_t": all_low_t}# 绘画折线图plt.plot(range(1, 7), temp["ave_t"], color="green", label="ave_t")plt.plot(range(1, 7), temp["high_t"], color="red", label="high_t")plt.plot(range(1, 7), temp["low_t"], color="blue", label="low_t")plt.legend() # 显示图例plt.ylabel("Temperature(°C)")plt.xlabel("day")# 显示plt.show()8.2 使用方法
直接用python运行pre_weather/Main.py,就会在控制台输出预测的数据
python pre_weather/Main.py或
在你的python代码里用joblib导入生成的模型,然后输入你的数据进行预测
(PS: 因为模型的训练用的数据日期和你预测数据的日期有关,所以不建议直接用使用非当天训练的模型进行预测,误差可能偏大)
如以下代码(在Main.py的11行):
import joblib
# 读取保存的模型model = joblib.load('Model.pkl')
# 最终预测结果preds = model.predict(r[1])其中,r[1]是预测数据或
参考Main.py,自己写一个符合你需求的启动文件
9 最后效果
本系列教程到这就结束了,代码具体还要以github项目:PYWeatherReport 为主,可能会在这个github项目上不定期优化更新